Using Distributed Tracing for debugging with Zipkin
This tutorial takes you through setting up a .NET Core application that sends tracing data to a Zipkin server.
Note
For more detailed examples, please refer to the Tracing project in the Steeltoe Samples Repository.
First, start a Zipkin instance. Depending on your hosting platform this is done in several ways.
Using the Steeltoe dockerfile, start a local instance of Zipkin
docker run --publish 9411:9411 steeltoeoss/zipkinOnce everything is finished initializing, you will see a message confirming startup:
Started ZipkinServer in xx secondsYou can view the Zipkin dashboard by navigating to http://localhost:9411
Next, create a .NET Core WebAPI that interacts with Distributed Tracing
Create a new ASP.NET Core WebAPI app with the Steeltoe Initializr
Name the project "DistributedTracingExample"
No dependency needs to be added
Click Generate Project to download a zip containing the new project
Extract the zipped project and open in your IDE of choice
Add
Steeltoe.Management.TracingCoreNuGet package to your project<ItemGroup> ... <PackageReference Include="Steeltoe.Management.TracingCore" Version="3.2.0" /> ... </ItemGroup>Add Distributed Tracing to your startup services
public void ConfigureServices(IServiceCollection services)
{
   // Other service registrations...

   // Available through Steeltoe.Management.Tracing namespace
   services.AddDistributedTracingAspNetCore();
}
Run the application
dotnet run<PATH_TO>\DistributedTracingExample.csproj
Navigate to the endpoint (you may need to change the port number) http://localhost:5000/api/values
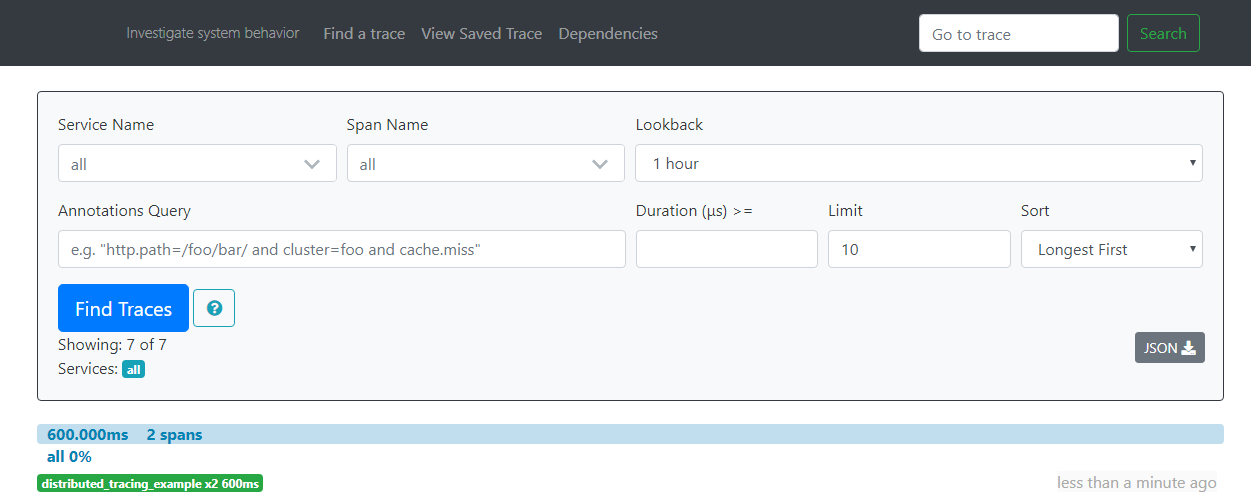
- Now that you have successfully run a request through the app, navigate back to the zipkin dashboard and click the "Find Traces" button. This will search for recent traces. The result should show the trace for your request.

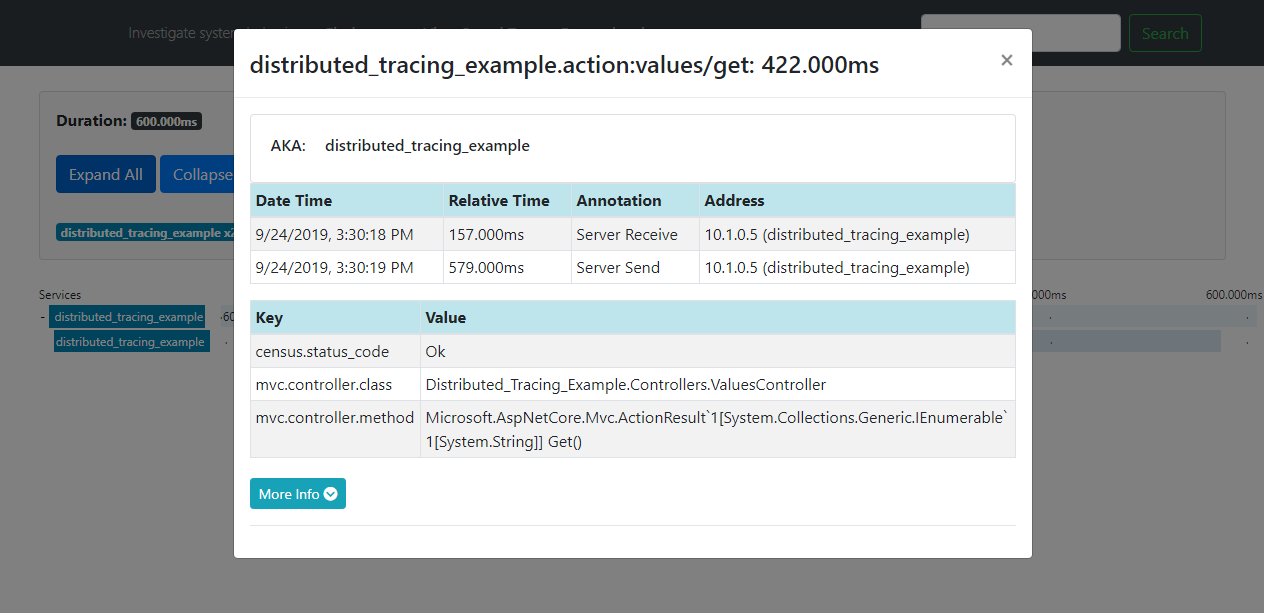
- Clicking on that trace will drill into the details. Then clicking on a specific action within the trace will give you even more detail.
